[vc_row full_width=”stretch_row_content” css=”.vc_custom_1541261976104{background-color: #1e73be !important;}”][vc_column][vc_column_text]

Technical Analysis – A Monster guide for a Forex Trader
“Technical analysis is a skill that improves with experience and study.
Always be a student and keep learning.”
John Murphy, Chief Technical Analyst at StockCharts.com

[/vc_column_text][/vc_column][/vc_row][vc_row][vc_column][vc_column_text]
Approximately 70% of all traders use technical analysis, but the big question is to what extent?
This also means that the rest (30%) who do not use technical analysis and they use some other form of analysis to make their trading decisions
Now
According to well know figures in the FX industry
90 – 95% of all traders lose money
It therefore follows that a big chunk of technical traders lose money?
If 90 -95%% of all traders lose money, does it mean that 100% of those who use technical analysis lose money?
and
30% of those who don’t use technical analysis actually make money?
Hmmm…
Why do so many technical traders lose money in the markets? Could it be that they are not using the indicators and tools as they should?
Or what could be the reason?

In this article, I will answer the questions above and give an insight on how to use technical tools and indicators to achieve an edge in your trading journey.
This article covers the following sections:
-
What is technical analysis
-
What is the Origin of Technical Analysis
-
Why and how does technical analysis work
-
What are the limitations of technical analysis
-
Three Basic Assumptions that Drive Technical Analysis
-
Schools of technical analysis
-
Different Types of Charts Used for Technical Analysis
-
Common Technical analysis chart patterns
-
Tools and indicators commonly use in Technical Analysis
-
Things to keep in mind about technical indicators ( IMPORTANT!)
-
Fundamental analysis and a comparison with technical analysis
-
An awesome list of books to learn Technical Analysis
Let us jump right into it
1.What is Technical Analysis?
Definition and history of technical analysis
As the name suggests, technical analysis, is
“A type of past price analysis which uses mathematical models and calculations to predict future price movements”
Supply and demand is driven by many factors including: fear, greed, financial incentive, herd instincts. These factors create repeatable patterns which we can recognise and profit from.
Technical analysis encompasses a wide range of charting techniques used to try and predict the move of a certain market. Technical analysis includes the use of:
- Pivot Points
- Time Cycles
- Trendlines
- Candlesticks Formations
- Moving Averages
- Chart patterns such as double top, head and shoulder, etc.
There are a lot of different aspects to technical analysis. It is not my intention to give advice on which technical patterns or indicators are better than others, but more to share with you some of the observations.
Technical analysis works only because it is similar to that of a self- fulfilling prophecy
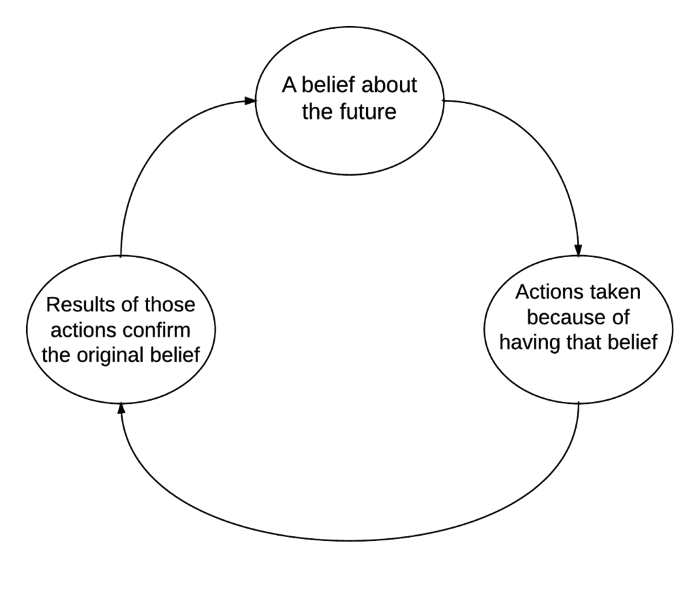 It will work only if many traders use it. Traders who rely on this type of analysis are often called technicians. Technicians use historic price data to predict future movements in an asset.
They operate guided by the assumption that history tends to repeat itself.
2.What is the Origin of Technical Analysis?

Munehisa Homma
Technical analysis is older than the Forex market. Yes, you guessed it right. Technical analysis predates the forex markets.
Technical analysis has been in existed for as long as there have been markets driven by the forces of supply and demand.
In the 17th Century, Dutch merchants used technical analysis in their trading and so did the Japanese Rice traders in the 18th Century.
Technical analysis was formally introduced to stock and currency trading towards the end of the 19th Century by Charles Dow.
Others who ushered in what has come to be known as the Golden Age of Technical analysis include
- Ralph Nelson Elliot (the Founder of the Elliot Wave Theory)
- Demille Wyckoff (the first market psychologist)
- William Delbert Gann (The Founder of the Gann Angles Theory)
3.Why does technical analysis work?
Simply put, technical analysis works because most traders consider it when making their trading decisions.
Technical analysts often trade what they see.
They are always on the lookout for certain patterns to print at specific levels. Once the patterns do print, a big number of traders take the same decision (either to buy or sell) and the markets move in line with the decision taken by these traders. but
The fact that price moves in line with analysis made by technical analysts should not in any way convince you that price respects lines drawn on the charts by technicians. In truth, price movements are driven by the interactions between buyers and sellers.
4.What are the limitations of technical analysis
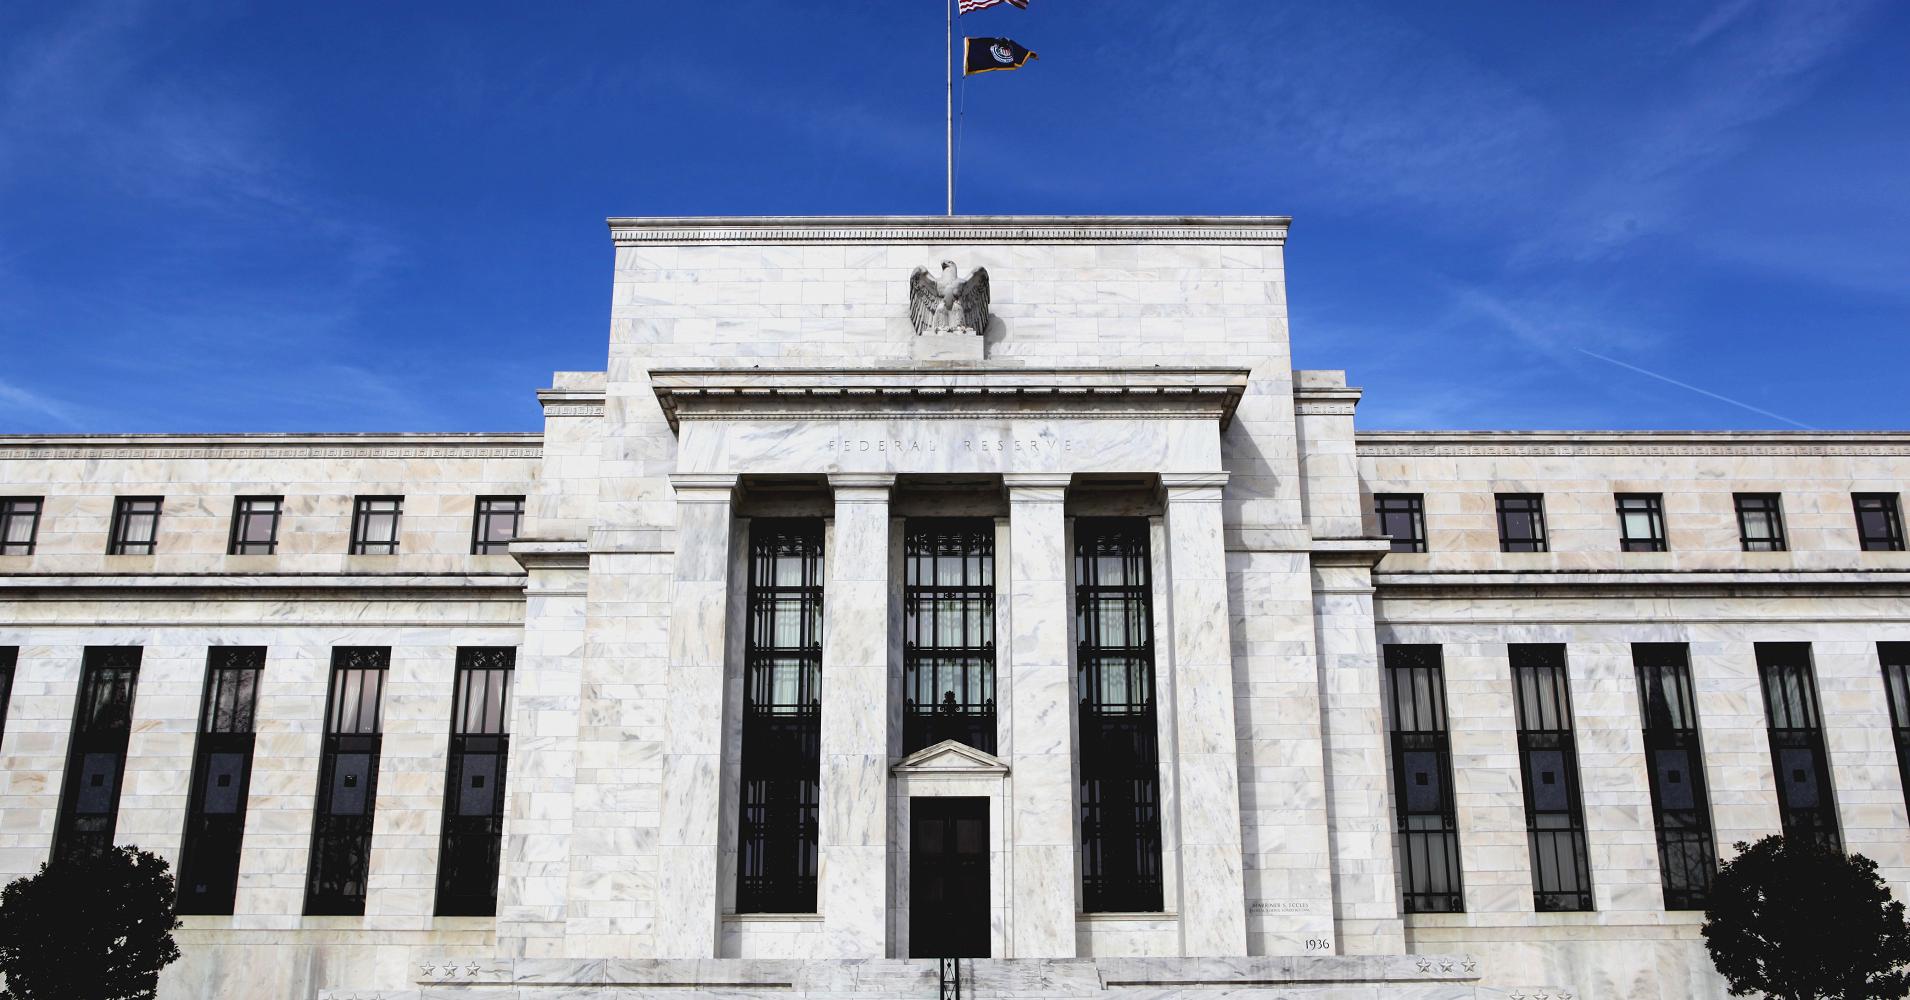
The release of highly important fundamental data can be very dramatic for a price action and technical analysis is of very limited use during these times.
These so called Risk Events are what determine the demand and supply of a given currency and cause major price shifts if the released news collides with the market expectations.
Technical analysis is often ineffective during the volatile times of the release.
However, it all depends on the kind of news and the deviation from the expected number. In many cases the price return to longer term trends.
It should be kept in mind that these are definitely not good times to try and detect trends or their tops and bottoms.
You are well advised to wait for calmer waters when technical analysis can be applied properly.
5.Three Basic Assumptions that Drive Technical Analysis
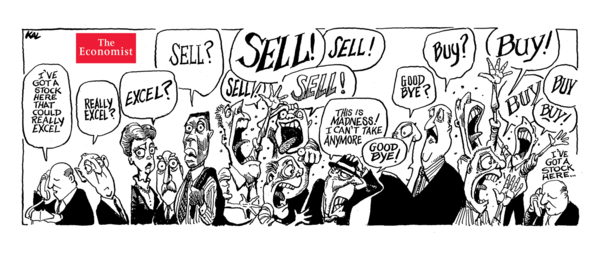
As stated above, technical analysis does not accurately predict future price. All it does is to give an estimation of future price movements.
This is done by looking at historic data and looking at the patterns that price “printed” in the past.
Technical analysts often rely on three assumptions when making their trading decisions:
- History tends to repeat itself
- The market discounts everything
- Price tends to move in trends
Now, let us briefly look at each of these assumptions
History tends to repeat itself
Most technical analysts bank on the repetitive nature of price. They assume that price will print the same pattern at specific levels because in their view, price movements is driven by market psychology which is in turn determine by a mix of fear and excitement in the markets.
The market discounts everything
Some often argue that technical analysis is a one-sided approach to market analysis. However, technicians believe that their approach to market analysis is sufficient because all the information that would affect the price of an asset has already been factored.
This means that most technicians do not bother themselves with looking at fundamentals and market psychology.
They believe that all these have already been factored into the price.
Their business is to wait for the price pattern to print then they take the appropriate trading decision.
Price tends to move in trends
Technical analysts believe that markets move in short, medium and long-term trends. They argue that price would rather move in any of the three trends than move erratically over time.
Based on this assumption, most technical analysts look to take trades in line with the identified trends.
Interestingly, technical analysis has birthed many different schools of though.
It is commonplace to meet so many traders who claim to be technical analysts but they all belong to different schools. Here are some of the schools:
6.What are “schools” of technical analysis
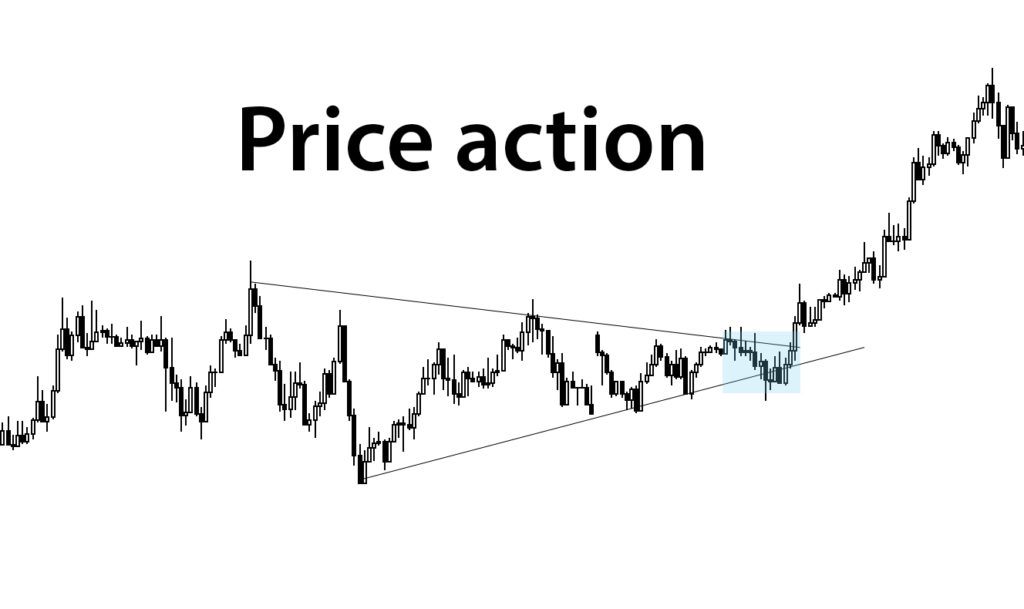
These traders use candle stick patterns, chart patterns, support and resistance to make decisions on whether to buy or sell an asset.
They consider where their preferred patterns have printed on their charts to make a trading decision.
There are many trading strategies that fall under this school:
- the pin bar trading strategy
- naked trading strategy
- the trendline trading strategy
are just some examples.
Wave Theory

Wave traders believe that market move in waves. They use this assumption to calculate where the market is likely to move. This school was founded by Ralph Nelson Elliot.
Wave traders believe that markets move in impulse and corrective waves with the former being longer than the latter.
They often use the Fibonacci extension and retracement tools to estimate where subsequent waves will be formed.
Elliot Wave Theory is classed as a type of technical analysis where all information about future prices is derived from the price itself rather than outside forces as is espoused by fundamental analysis.
Many fundamental analysts have discounted the practice, yet Elliott wave lives on, despite the backlash!
Elliott wave has emerged from obscure origins, to a point where there are now university courses on the subject.
7.Different Types of Charts Used for Technical Analysis
A chart is defined as a graphical representation of a series of prices plotted on the Y-axis against time which is normally plotted on the X-axis.
There are many different types of charts that are available to traders. However, for the purpose of this guide we shall confine ourselves to discussing four popular types of charts:
- Point and Figure charts
- Line Graph
- Bar charts
- Candlestick charts
Point and Figure Charts

These are not very popular among the average traders and investors. These charts were used by the very first technical traders. The charts eliminate the time and volume aspect of price and only show trend of the asset under consideration.
Line Charts

A line chart is a representation of closing prices of an asset over the chosen time frame. This type of a chart is often used by investors and traders to determine trends.
Figure showing a daily line chart for AUDCAD
Bar Chart

Unlike the line graph which only presents the close price, bar charts are designed to show the open, close, high and low prices of an asset for a specified time frame.
Figure showing bar daily chart for AUDCAD. The individual bars are labelled as shown below

Points to note:
- When the open is above the close, the result is a bearish bar
- When the open is below the close, the result is a bullish bar
Traders use bar charts to enter their trades because the chart gives them all the price information (high, open, close and low), which they can use to make informed trading decisions.
Candlestick Charts

Just like bar charts, candlestick charts show the open, close, high and open prices of an asset for a specified time frame.
Candlesticks are believed to have been developed in the 18th Century by a Japanese rice trader by the name Munehisa Homma.
The candlestick charts were later introduced to the Western world by Steve Nison, who is considered to be the Father of Modern Candlesticks
Figure showing the daily candlestick chart for AUDCAD
Consider this diagrammatic illustration of the parts of a bullish and bearish candlestick

Most traders like using candlestick charts because they can rely on them to find tradable candlestick and chart patterns.
Note:
You can get these different types of charts on the Meta Trader 4, Meta Trader 4, Ctrader, Tradingview (https://www.tradingview.com/) and on Stockcharts.com (https://stockcharts.com)
8.What are Common Technical Analysis Chart Patterns
As stated earlier, chart patterns are printed on the chart. There are many different types of chart patterns. In this section we will focus on the most common ones.
Head and Shoulders and Inverted Head and Shoulders
These patterns are considered to be trend reversal chart patterns. When they print on a chart, the technical trader looks for opportunities to enter the trade in a direction opposite to the previous trend of the market. Head and shoulders are formed on an uptrend while inverted head and shoulders are formed on a downtrend.
Head and Shoulder

Inverted head and shoulder

Triangles
Triangles are chart patterns that form within a trend alerting the trader of a possible explosive movement. The breakout in price can either be in the direction of the current trend or opposite to the current trend.

Figure showing three types of triangle chart patterns
Note:
- When an ascending triangle appears on an uptrend, get ready for the resumption of the uptrend
- When a descending triangle appears on a downtrend, get ready for the resumption of the downtrend
- When you see a symmetrical triangle, you should be prepared for a breakout to either sides of the triangle
Double tops and Double Bottoms
These are price reversal patterns that are printed after an extended move to the upside or to the downside. When they appear around support or resistance zones, technical traders use them to enter trades.
Double top chart formation

Double bottom formation
 Note: Some technical traders call double tops (M’s) and double bottoms (W’s) based on the shape they make when they print on a chart.
9.Tools and Indicators Used in Technical Analysis
Technical analysts use tools and indicators to analyse the price charts and make a trading decision. Some of the common indicators include
- Moving Averages
- RSI
- MACD
- Stochastics
It is ill-advised to overly rely on indicators because they are lagging. This means that they give signals long after price has already given a better entry. If you ever decide to use them, better use them to confirm price action.
An interesting twist
Moving averages give signals a few candles after the real price action has happened.
They also act as dynamic support and resistance.
RSI, MACD and Stochastics purport to measure overbought and oversold market conditions but in truth, traders can continue buying in an overbought condition and keep on selling in oversold conditions.
Technical indicators such as the below are leading and much more effective in technical analysis.
Pivot Points
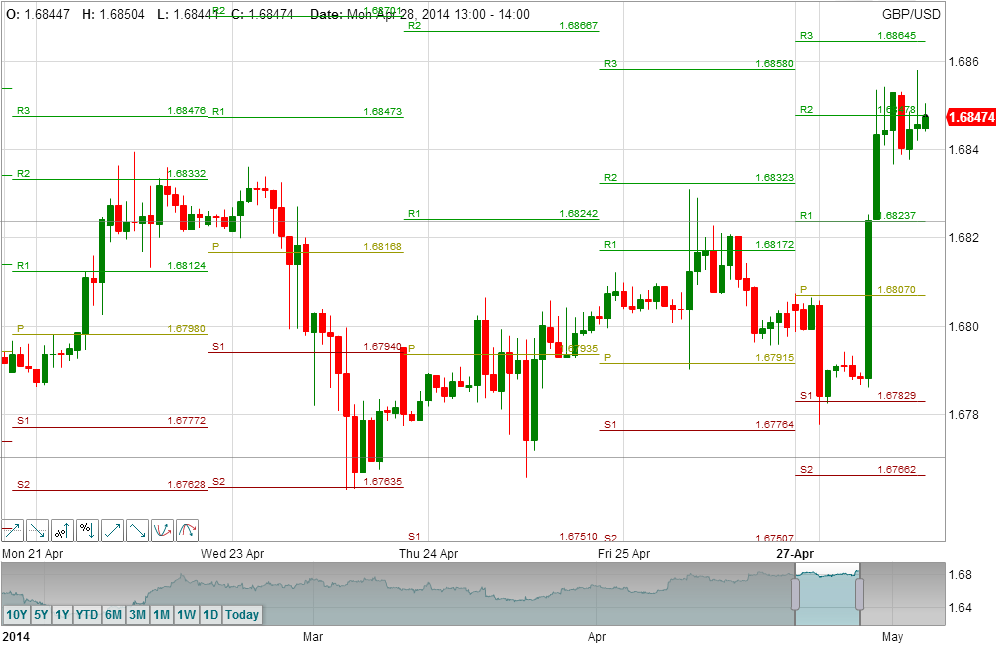
Over sold/bought indicator. Probably the oldest indicator on the planet. Draws the future levels based on the average price in the past. I exit my long positions around high pivot points and exit my short positions on low Pivot Points. I also use central Pivot Point as a reversal signal on lower time frames.
DOWNLOAD IT HERE (Metatrader4 only)
Fibonacci Retracements
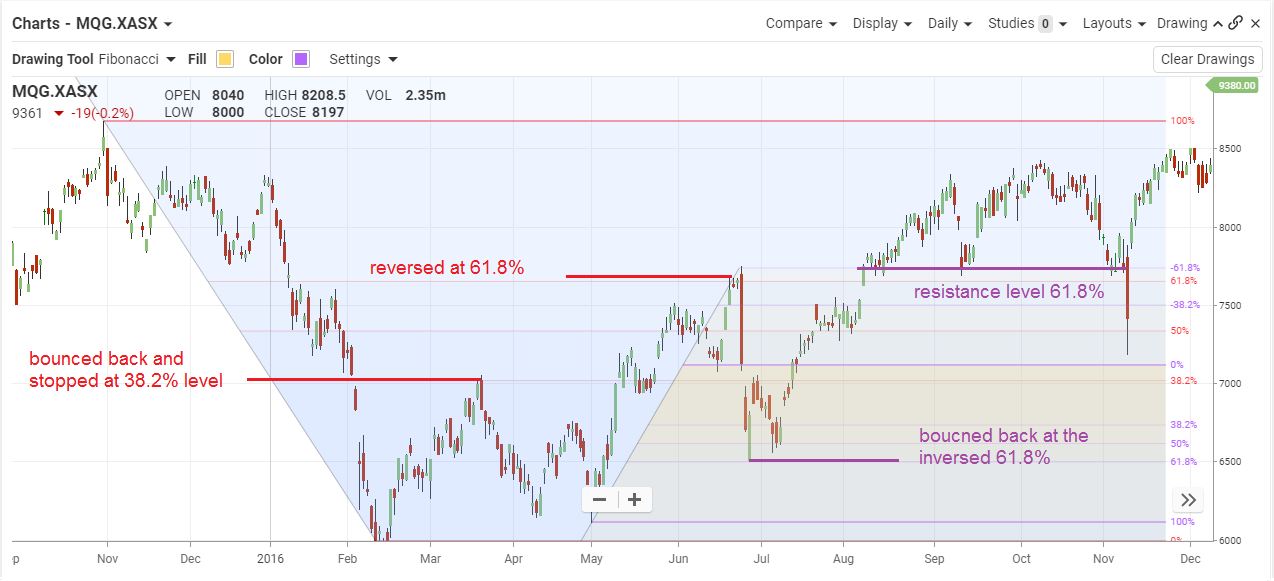
Retrecement indicator. Measures potential retrecement size. Markets tend to get exhausted around 38%-50% retrecement zones most of the time.
I consider 38%-50% retrecement as a mature support zone and look to buy the rising markets.
Support and Resistance
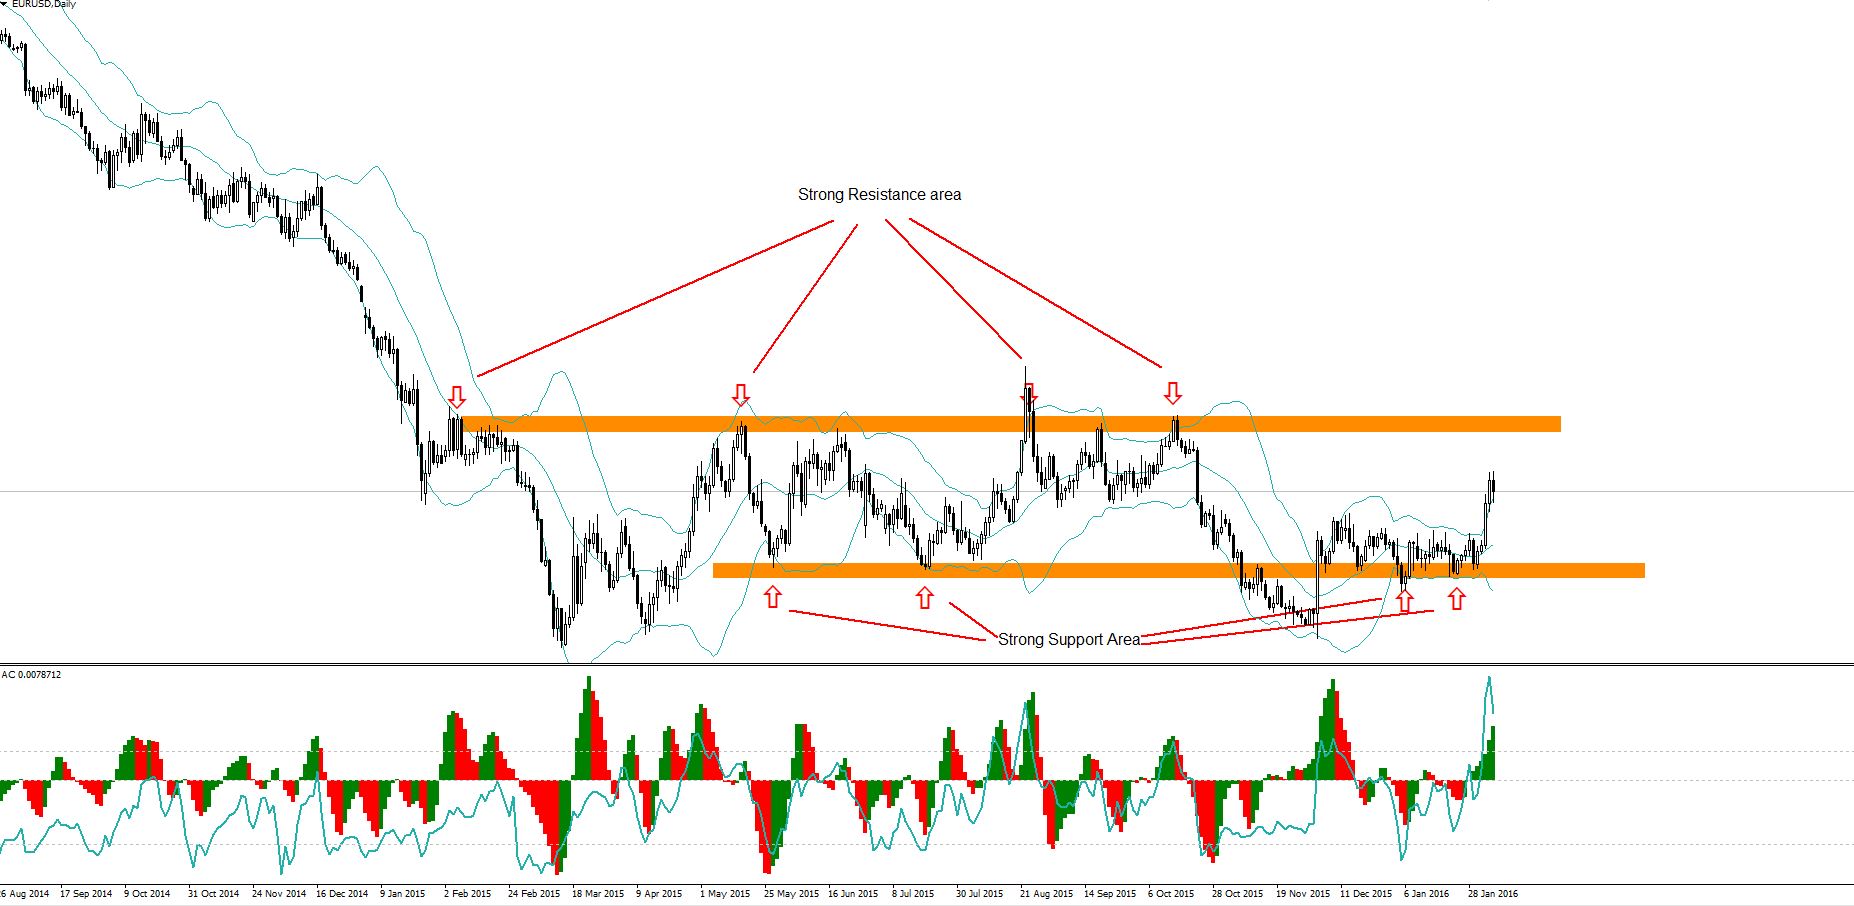
Supply and Demand indicator. Any successful trader has to have a thorough knowledge of support and resistance.I NEVER sell the support or buy the resistance. Only buy support in rising market or resistance in falling markets are often thought to be leading indicators because they capture price action as and when it is forming. However,
The MOST IMPORTANT
leading indicator in Forex is
PRICE
Note:
Do you know how accurate are the indicators you are currently using?
You can use a strategy tester that comes with your MT4 to test the indicators and get to see how they react to different market conditions.
You will be surprised with the results.
There are a few indicators which are very reliable. This is because big orders are placed around these levels. These are
- Support and Resistance
- Pivot Points
- Retrecements ( Fibs)
10.Important things to keep in mind about technical indicators
The price moves indicators – not the other way around.
This is why they are called lagging and this is why they repaint. This is why they always look profitable when you look at them at the left hand side of the chart when the price action is already unfolded.
All indicators are derivative of the same data – high, low, open, close
There is no other data in your trading platform. All indicators are being fed by the same data hence they are the same Indicators and other tools are designed to help you with your strategy rather than being a strategy themselves.
I use only a few indicators, mainly leading ones as an addition to my price driven strategy. The starting point for me is always the
Commitments of Traders and Risk Events Calendar
Before even thinking about entering a trend trade, I want to know where is the price likely to go in the long term and what big institutional traders are doing in the market
Here is great PDF I created on how to use Commitments of Traders to form your long term bias.
Download it
to learn how I use C.O.T
11.Can You Combine Technical Analysis and Fundamental Analysis?
Fundamental analysis, which is a method of analysis an asset to determine its intrinsic value, uses economic indicators such as monetary policy, fiscal policy and interest rates.
It is important for all traders to pay attention to these fundamentals.
A trader who combines both technical and fundamental analysis stands a better chance of making it in the forex markets.
A trader needs to know that markets move due to three dynamics:
- Prices are driven by large volumes of orders.
- These orders are influenced by risk events and
- Often executed around major technical levels
Major price reversals often take place when a significant market report doesn’t accord with the market’s expectation, while the price is trading around major support or resistance zones.
This is a perfect, low risk, high probability scenario! And it works. Often
Think about Warren Buffet or Gorge Soros. Do you really think they are looking at the same or similar charts to yours?
They didn’t make their fortunes by using technical analysis alone. They did it by understanding and analysing the markets first.
If you think you can be successful in this game by ignoring fundamentals, you are just fooling yourself.
Trader needs to relate technical levels to the risk events and the market sentiment at the time.
Orders will be driven by money market economics but placed around technical levels to lower the risk.
Key Takeaways
- Don’t rely too much on your technical indicators
- Keep it simple and move beyond it
- There is more to trading than a technical analysis
12.What are The Best Books to learn Technical Analysis
Here is a list of some of the best technical analysis books
The FX Bootcamp Guide to Strategic and Tactical Forex Trading
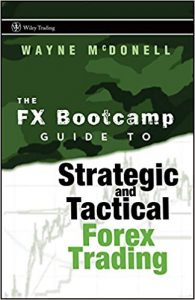 This easy read is tailored to guide traders on how to formulate a trading strategy that is backed by a comprehensive trading plan. In this book.
the author also spends some time discussing how trading psychology can be used in combination with technical analysis to help a trader gain an edge over the market.
Beat the Odds in Forex Trading: How to Identify and Profit from High Percentage Market Patterns
 This is a book written by a successful trader seeking to reveal the predictability of the forex markets.
Traders at all levels can benefit from this simplified guide.
Using a simple bar chart, the author presents examples of patterns that traders should pay attention to.
Day Trading the Currency Market: Technical and Fundamental Strategies to Profit from Market Swings
 This book is one of a kind as it presents actionable trading strategies that have been formulated by combining both technical and fundamental analysis.
Traders can rely on the strategies presented in this guide to profitably day trade the currency markets
Trade Stocks and Commodities with the Insiders: Secrets of the COT Report

In this book, traders get a chance to read on how smart money operates in the market.
The reveals some interesting tips and tricks on how to use the COT report to trade like an insider in the forex markets.
Long-Term Secrets to Short-Term Trading
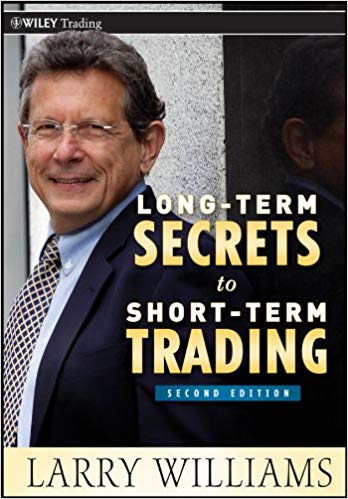
If you desire to learn how to consistently make profits trading in the short-term, then this is the book for you.
Written by a successful short-term trader, you will be able to follow his thought process and find trading opportunities that will give you the profits you desire[/vc_column_text][/vc_column][/vc_row][vc_row][vc_column][vc_column_text]
Conclusion
In closing, it is worth remembering that technical analysis is only but one of the ways by which you can trade the forex markets.
If you decide to use it in your trading journey, then make sure that you do it right. One way of doing this is by combining it with fundamental analysis, sentimental analysis and trading psychology.
To thrive in this market, you must also commit yourself to follow a strict money management plan. Gain an edge over the markets by combining all the elements that have been discussed above.
And you will be just fine[/vc_column_text][/vc_column][/vc_row][vc_row][vc_column][stm_post_comments][/vc_column][/vc_row]
